DATABRIGHT
WebPivotTable Component
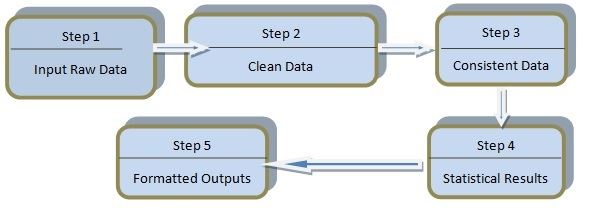
In the above figure we can see an overview of data analysis stages. Each of the boxes represents one stage through which the data passes. The first three steps fall under the data-cleaning mechanism, while the last two are part of data analysis.
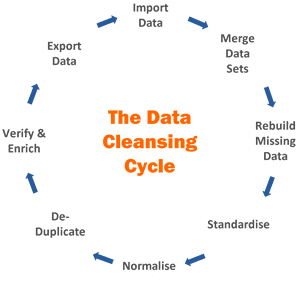
Raw data — This is the data as it comes in. In this state there could be three potential problems:
- The data may not have the appropriate headers.
- The data may have incorrect data types.
- The data may contain unknown or unwanted character encoding.
Technically correct data — Once the raw data is modified to get rid of the above listed discrepancies, it is said to be "technically correct data."
Consistent data — In this stage, data is ready to be exposed to any sort of statistical analysis, and can be used as a starting point for analysis.
Statistical results and output — After getting statistical results, they can be stored for reuse. These results can also be formatted so that they can be used for publishing various kinds of reports.
Visual Representation of Data
Representing the data in a well-structured format which is readable and understandable to the audience is vitally important. Handling the unstructured data and then representing it in a visual format can be a challenging job which organizations implementing big data are going to face in the near future. To cater to this need, different types of graphs or tables can be used to represent the data.
